 Ichimuhan

 01Daily Forecast
Daily EURUSD Forecast.
- Forecast Published Daily Before Market Open, Not After.
- Forecast Includes Possible Scenarios, and Outcomes.
- Forecast Will Be The Roadmap For The Execution.
Get daily EURUSD Forecast, published 1 day prior, more than 14 years experience in trading currencies, currently focusing only on single pair "EURUSD", analysis based on key Fibonacci levels with excution based on Ichimoku as you never seen before!
Surviving The Market Since2010
EURUSD liquidity is by far higher than any tradable instrument, focusing one single instrument will reduce the distraction, make you get better understanding of the market maker moves. Thus you can utilize every movement EURUSD make.
The Most Liquid Tradable Instrument.
Tight Spread Compared To Other Pairs.
Daily Average Move of 20-30 Pips.
Opportunity Through Out The Day From Tokyo Till NewYork Session.
"Trader Who Never Document The Opportunity, It's like He Never Saw it!"
More then 14 years experience in financial market, got into the feild for income, and continued for the passion. For almost 6 years I became consistent and started to share my insight about the market in different platforms. I decided to start my own place, where I can share my daily analysis and execution on the market.
 Target
 Hit
Hit Target
 Hit
Hit Target
 Hit
Hit Summary
 Summary (full)
Clear Entry, Stop Loss, Take Profit, And Management plan.
Nothing Is Deleted, Re-priced Or Share after the Action.
All Previous Daily Forecast & Execution Trades Are Documented.
YOUR JOURNEY TO THE MARKERT STARTS HERE!
01Daily Forecast 02Live Execution
 03The Record
Published Everyday, Prior To Market Open.
2 shown
Price Structure
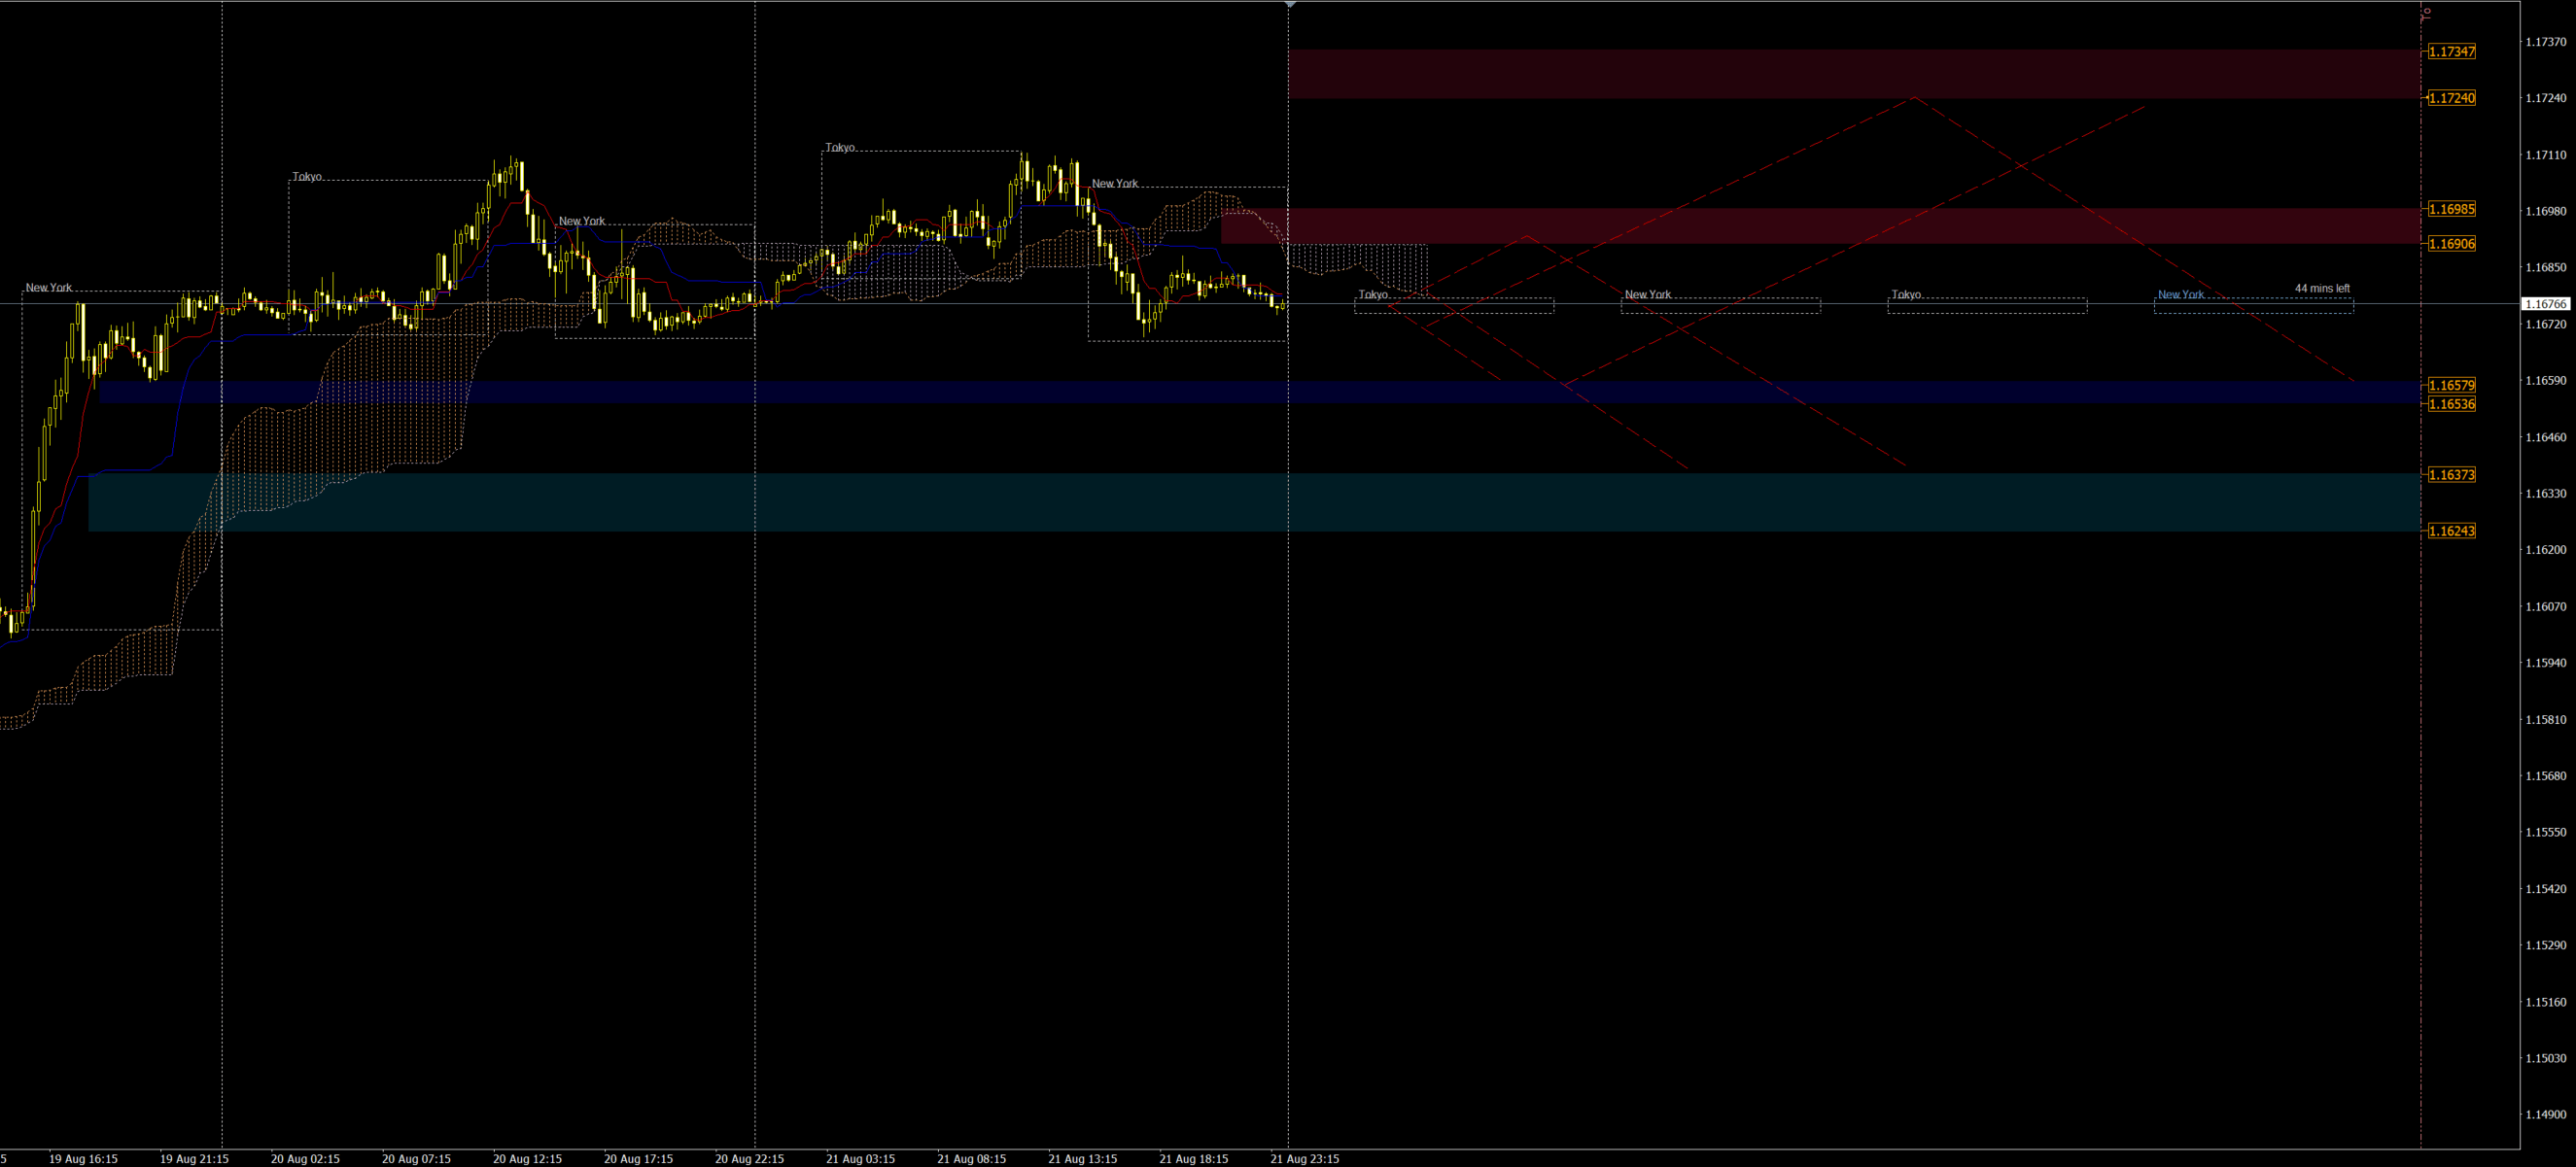
o Conflict zone, 1.1675 vs 1.1651, with most recent structure being HH.
o Holding of 1.1651 supports BoS aiming for 1.172.
Previous 48H.
Tokyo: Direction: Uptrend, with bullish close New High/Low: None.
New York: Direction: Downtrend, with bearish close New High/Low: None.
Previous 24H
Tokyo: Direction: Downtrend New High/Low: Low.
New York: Direction: Downtrend, with bearish close New High/Low: Low.
Interpretations:
Price in Bullish wave currently, last sessions started to show weakness of bullish momentum (Last Tokyo turned now to be bearish, and NY had bearish closed previously), with formation of double top on 15Min TF 2 days ago, this might signal a start for corrective bearish wave, unless NY session reclaimed the bullish momentum and broke above Tokyo high of 1.1687.
Possible Scenarios:
Possibly Tokyo will look continuation of the corrective bearish and aligns with London and NY, targeting (1.1661 – 1.1657 – 1.1647 - 1.1635).
If Tokyo remains bullish, prices continue up to 1.1710 and a break of 1.1711 will target 1.1720 area.
During NY, if both Tokyo and London, failed to break 1.171 and continued pushing price down, possibility of corrective wave increases, targeting (1.1647 - 1.1635).
Current Fibo levels: 1.1635 – 1.1644 – 1.1672 – 1.1687 – 1.1709.
THIS IS JUST A FORECAST FOR THE UPCOMING SESSIONS; TRADES EXECUTION WILL DEPEND ON PRICE ACTION AND CONFIRMATION SIGNS.
Price Structure
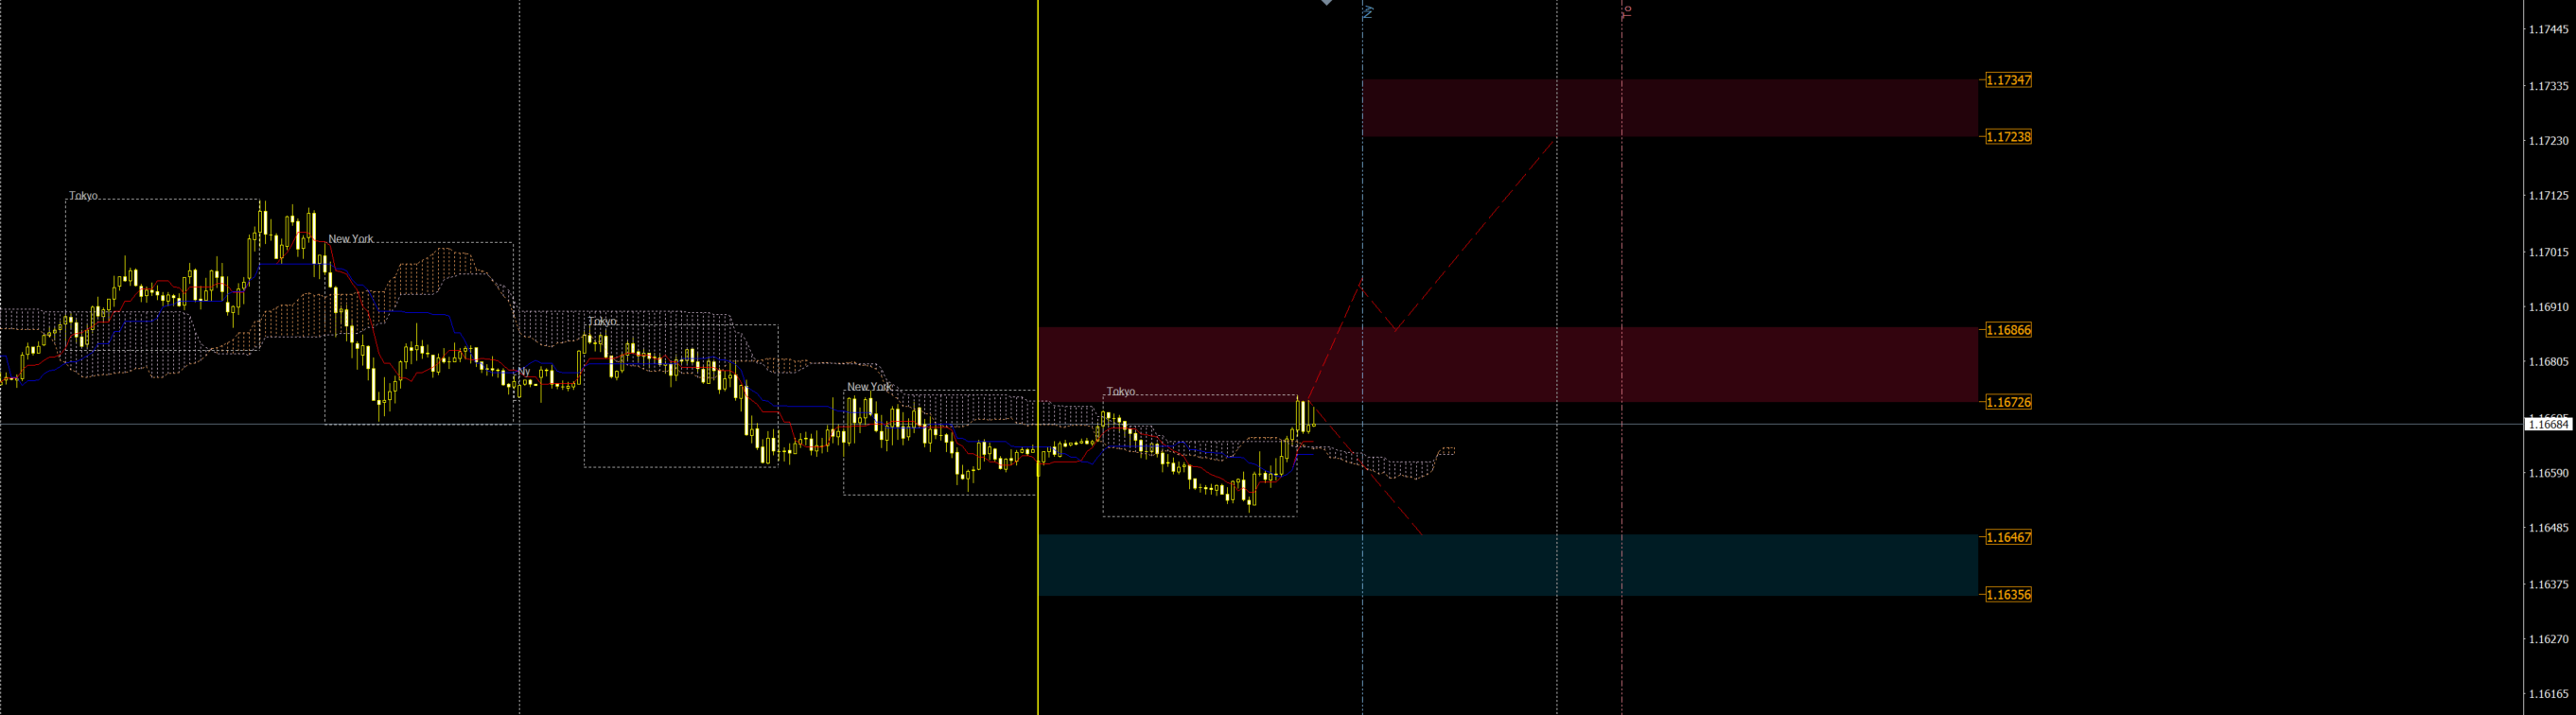
o Conflict zone, 1.1711 vs 1.1669, with most recent structure being HH.
o Holding of 1.1668 supports BoS aiming for 1.172.
Previous 48H.
Tokyo: Direction: Uptrend, with bullish close New High/Low: High.
NewYork: Direction: Consolidated New High/Low: None.
Previous 24H
Tokyo: Direction: Uptrend, with bullish close New High/Low: None.
NewYork: Direction: Downtrend, with bearish close New High/Low: None.
Interpretations:
Price in Bullish wave currently, last sessions started to show weakness of bullish momentum (Last Tokyo still bullish, and NY had bearish closed), with formation of double top on 15Min TF, this might signal a start for corrective bearish wave, unless NY session reclaimed the bullish momentum.
Possible Scenarios:
1- !!Possibly Tokyo will look for Pull up to close buying positions and align with NY in the bearish corrective wave, pull up range 1.1686 - 1.170 from here, a retracement in Tokyo will push the prices down to 1.1671 – 1.1662.
!!2- If Tokyo remains bullish, prices continue up to 1.1710 and a break of 1.1711 will target 1.1720 area.
3- During NY, if both Tokyo and London, failed to break 1.171, possibility of corrective wave increases, targeting (1.1661 – 1.1657 – 1.1647 - 1.1635).
- Current Fibo levels: 1.1601 – 1.1635 – 1.1657 – 1.1676 – 1.1694 – 1.1709 – 1.172.
THIS IS JUST A FORECAST FOR THE UPCOMING SESSIONS; TRADES EXECUTION WILL DEPEND ON PRICE ACTION AND CONFIRMATION SIGNS.
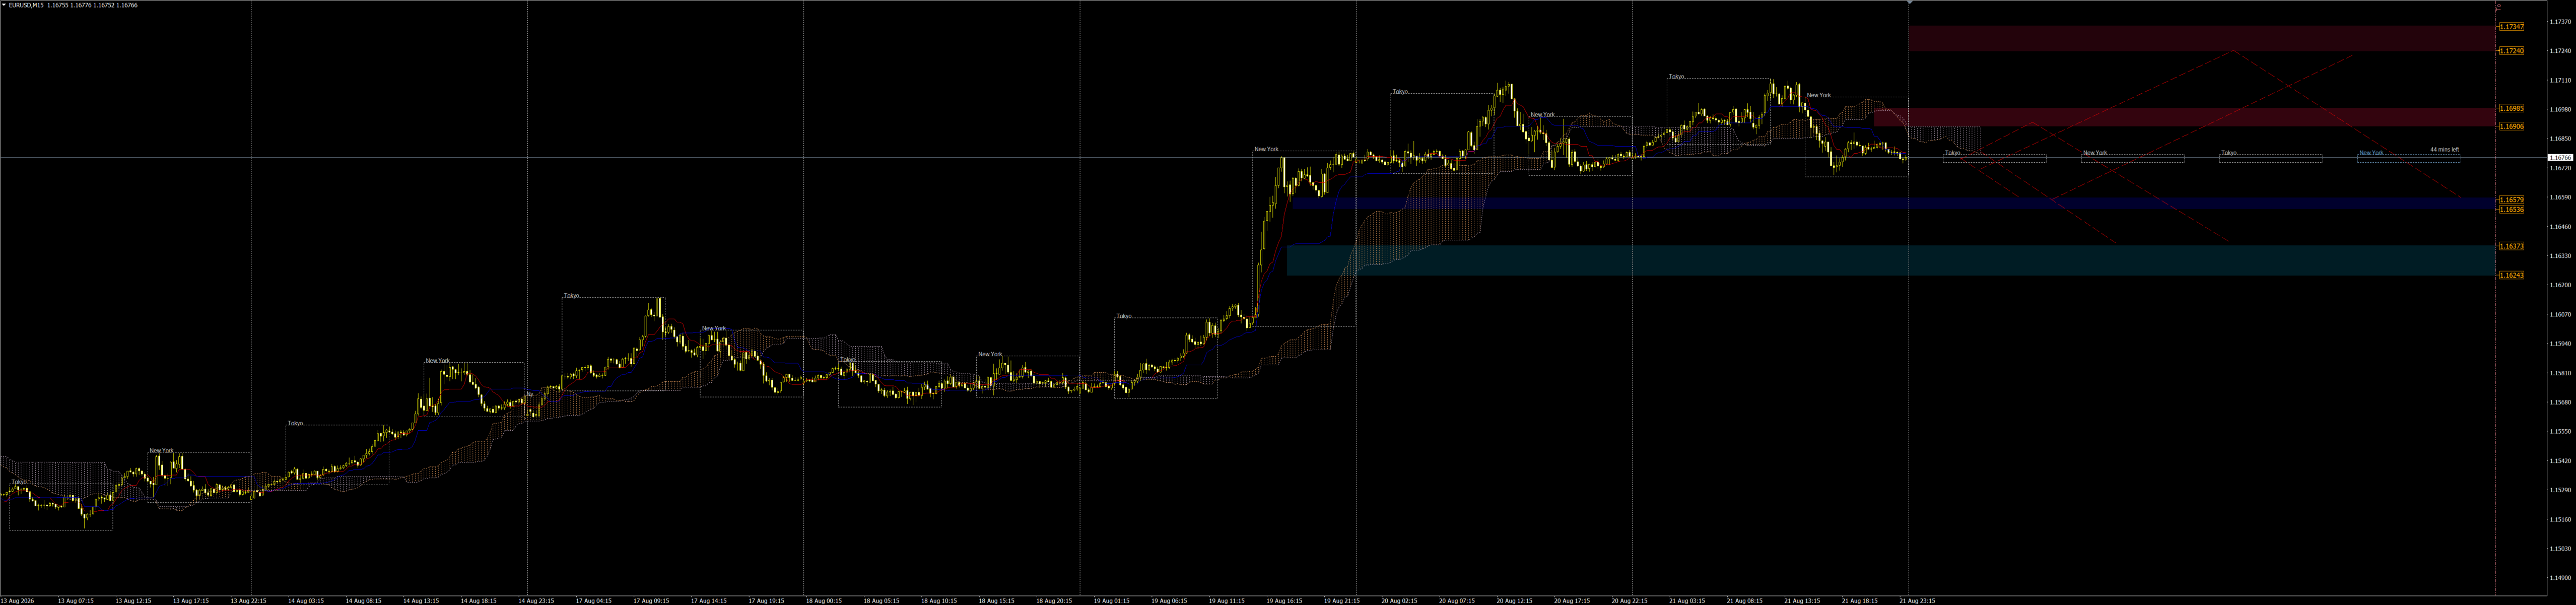
Includes a chart based on Key Fibo Levels, and prior sessions behavioral analysis. To give inslight about possible scenarios, with suggested trading condition to confirm the bias. Posted in the Dashboard, and Share via Email.
Is it worth it? Decide yourself. Try the full service for 10 days, no credit card required.
Please refer to the free plan to test it yourself if it worth it. If you decide to support the service, you can upgrade at any time.
This will give you access to the service and all its features for 1 month, which includes an average of 20 daily Forecast and 1-2 daily intra-day live trades (Approximately 20-40 trades per month) .
EURUSD liquidity is by far higher than any tradable instrument, focusing one single instrument will reduce the distraction, make you get better understanding of the market maker moves. Thus you can utilize every movement EURUSD make. Also it has a daily average move of 20-30 Pips, and from my experience it can provide alot of opportunities through out the day from Tokyo till NewYork session.
Its a normal thing in this business, as long we have solid risk management plan and near perfect execution a losing trade shouldn't hurt us, and losing call gets the exact same email as a winner: the result, the pips, how long it ran. Lossing is a inevitable, not to be ashamed off.
No. Every position carries a conviction grade and a fixed risk to reward, so the sizing is yours to decide. The desk never states a lot size and never tells you what to risk.
You will receive a daily Forecast before the market open for the possible scenarios for the EURUSD, along with instant trades that executed throughout the day.
No. Cancelling from settings stops the next charge with no notice period, but Ichimuhan doesn't refund the current or any prior billing period. The 10-day free trial exists so you can decide before the first charge ever happens.
No. Every forecast and execution plan is published research and analysis, not a personalised recommendation, and Ichimuhan is not a regulated broker or advisor. Trading carries real risk of loss, read the risk disclosure before you take a seat.
For me this is a daily routine, I depend on my trading for an income, and this is a perfect oppotunity for a win-win situation between me and the other traders who strugle in this market.