 Ichimuhan


A good Fibonacci EUR/USD analysis doesn't start by drawing a retracement wherever looks convenient. It starts by picking one specific, defensible swing on the chart.
Everything after that, the entry, the target, the stop, is measured off that single swing, not eyeballed separately.
Step one: find the swing, not the trend
A trend is an opinion. A swing is a fact you can point to: the most recent completed move from a confirmed low to a confirmed high, or high to low, with no higher high or lower low breaking it in between.
Ichimuhan retracements are drawn on the last completed swing only, never on a trend line someone drew to fit a narrative. If the swing isn't finished, meaning price is still making new extremes in the same direction, there's no valid retracement to draw yet, and no level gets published. If you want to practice spotting and drawing that swing yourself before you ever rely on a published one, how to draw a Fibonacci retracement walks through it on a real chart.
Step two: the retracement gives three numbers
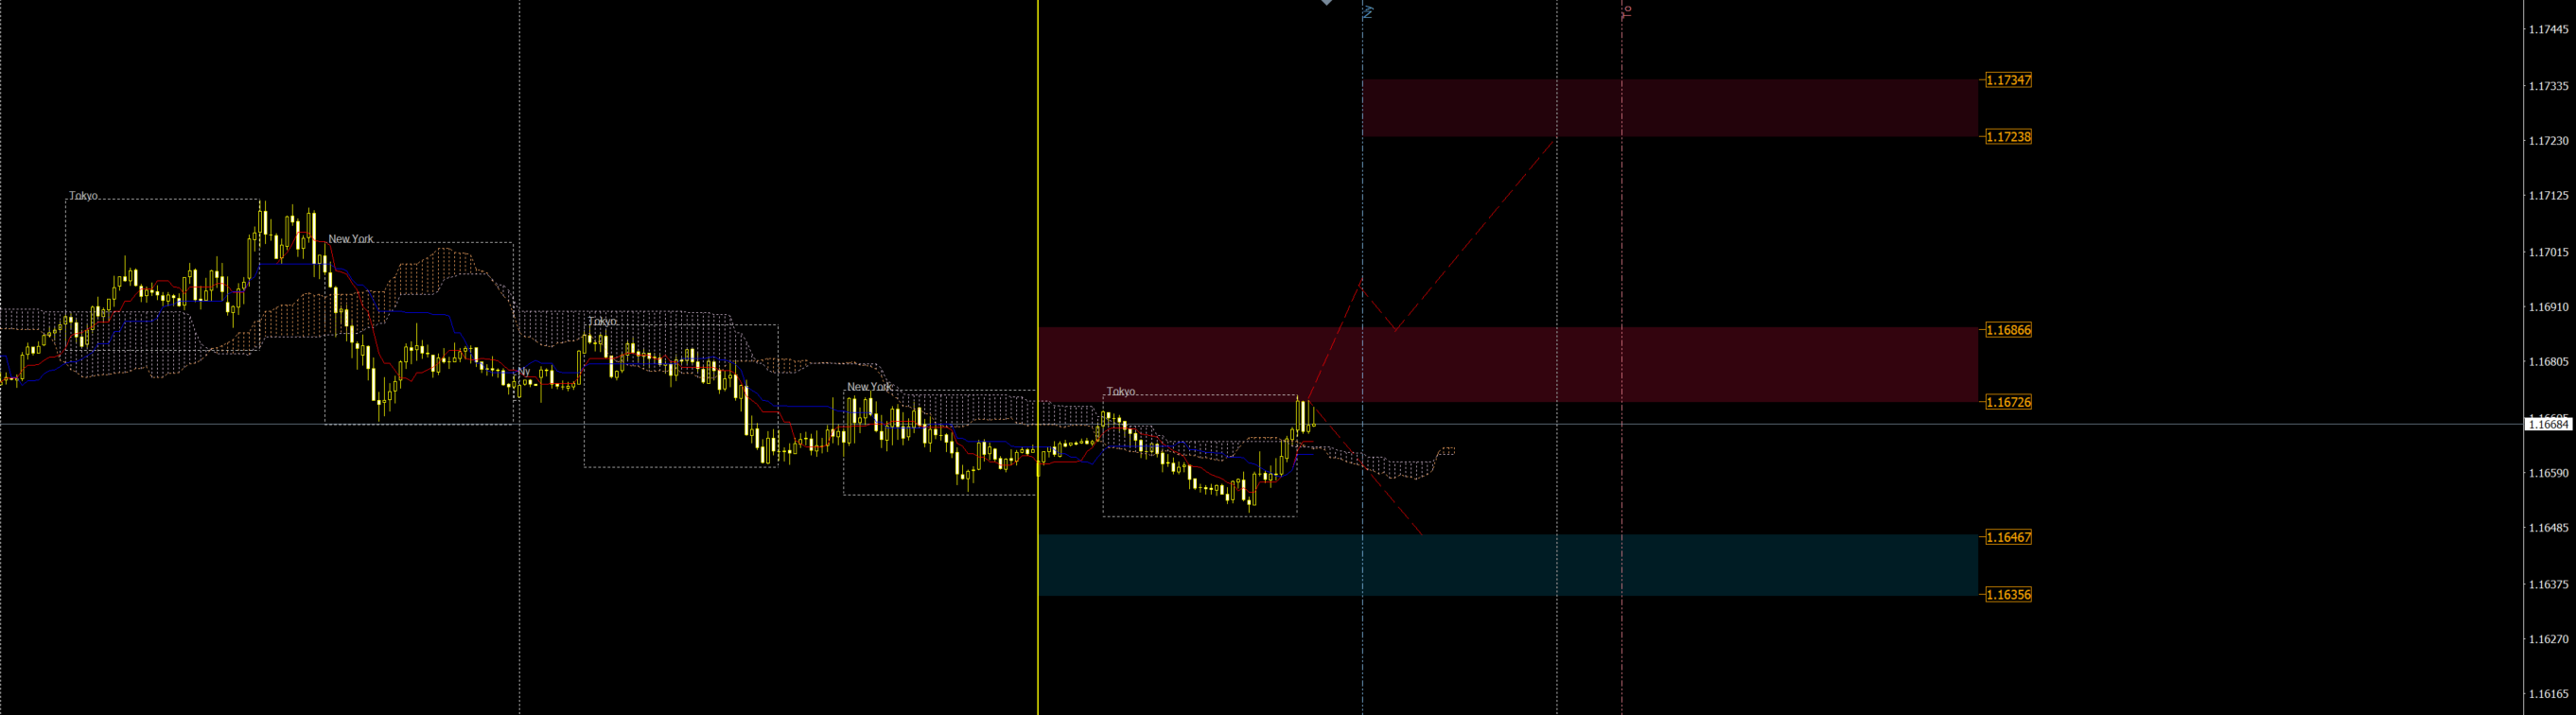
Once the swing is fixed, the standard Fibonacci retracement levels of 38.2%, 50% and 61.8% mark where a pullback into that swing is statistically likely to find buyers or sellers before the prior move resumes. From there:
- Entry sits at the retracement level that lines up with where the Ichimoku Cloud already says the market has committed to a direction. Not just any Fib level, the one the cloud read agrees with.
- Stop sits beyond the next retracement level out, past the point where the original swing would be invalidated if price kept going.
- Target sits at a Fibonacci extension of the same swing: a measured projection, not a round number picked for looking tidy on a chart.
Why the stop isn't optional
A retracement without a stop is half a plan. The stop isn't a formality tacked on at the end; it's the level that proves the swing you drew was wrong, and it has to be fixed before the trade goes on, not adjusted afterward once price gets uncomfortably close. What a stop actually is, and why moving it after the fact defeats its own purpose, is covered in what a stop-loss actually does.
Why the Cloud has to agree first
Fibonacci on its own can produce a valid-looking level in either direction on the same chart. That's the honest limitation of the tool: critics of the method note that retracement levels are just as likely to coincide with other, non-Fibonacci price points across large samples of charts. It measures a swing; it doesn't know which way the broader market is actually leaning.
That's a separate question, answered separately by the Ichimoku Cloud, covered in how to read the Ichimoku Cloud on EUR/USD. Ichimuhan never publishes a Fibonacci level that contradicts the cloud's direction. When the two disagree, nothing gets published until they don't. The full case for combining both tools, rather than trusting either alone, is in Ichimoku Cloud plus Fibonacci, why one method isn't enough.
What this looks like once it's published
A level on a chart isn't a trade plan yet. It becomes one once it carries a stated entry, target, stop, and a conviction grade showing how strongly the cloud and the retracement actually agreed, which is a different strength signal than the levels themselves. See exactly how to read one, line by line, in how to read a published EUR/USD trade plan.
The Cloud gives the direction. It does not give the price to pay. Those three numbers all come from the same swing and the same set of ratios, measured once, not assembled from three separate guesses.