 Ichimuhan
"The Ichimoku Cloud is a lagging indicator" is the most common objection to it, and it's half right. Two of its five lines genuinely do lag price. The other three, including the cloud itself, don't. Most people who dismiss the indicator have only ever looked at the lines that lag.
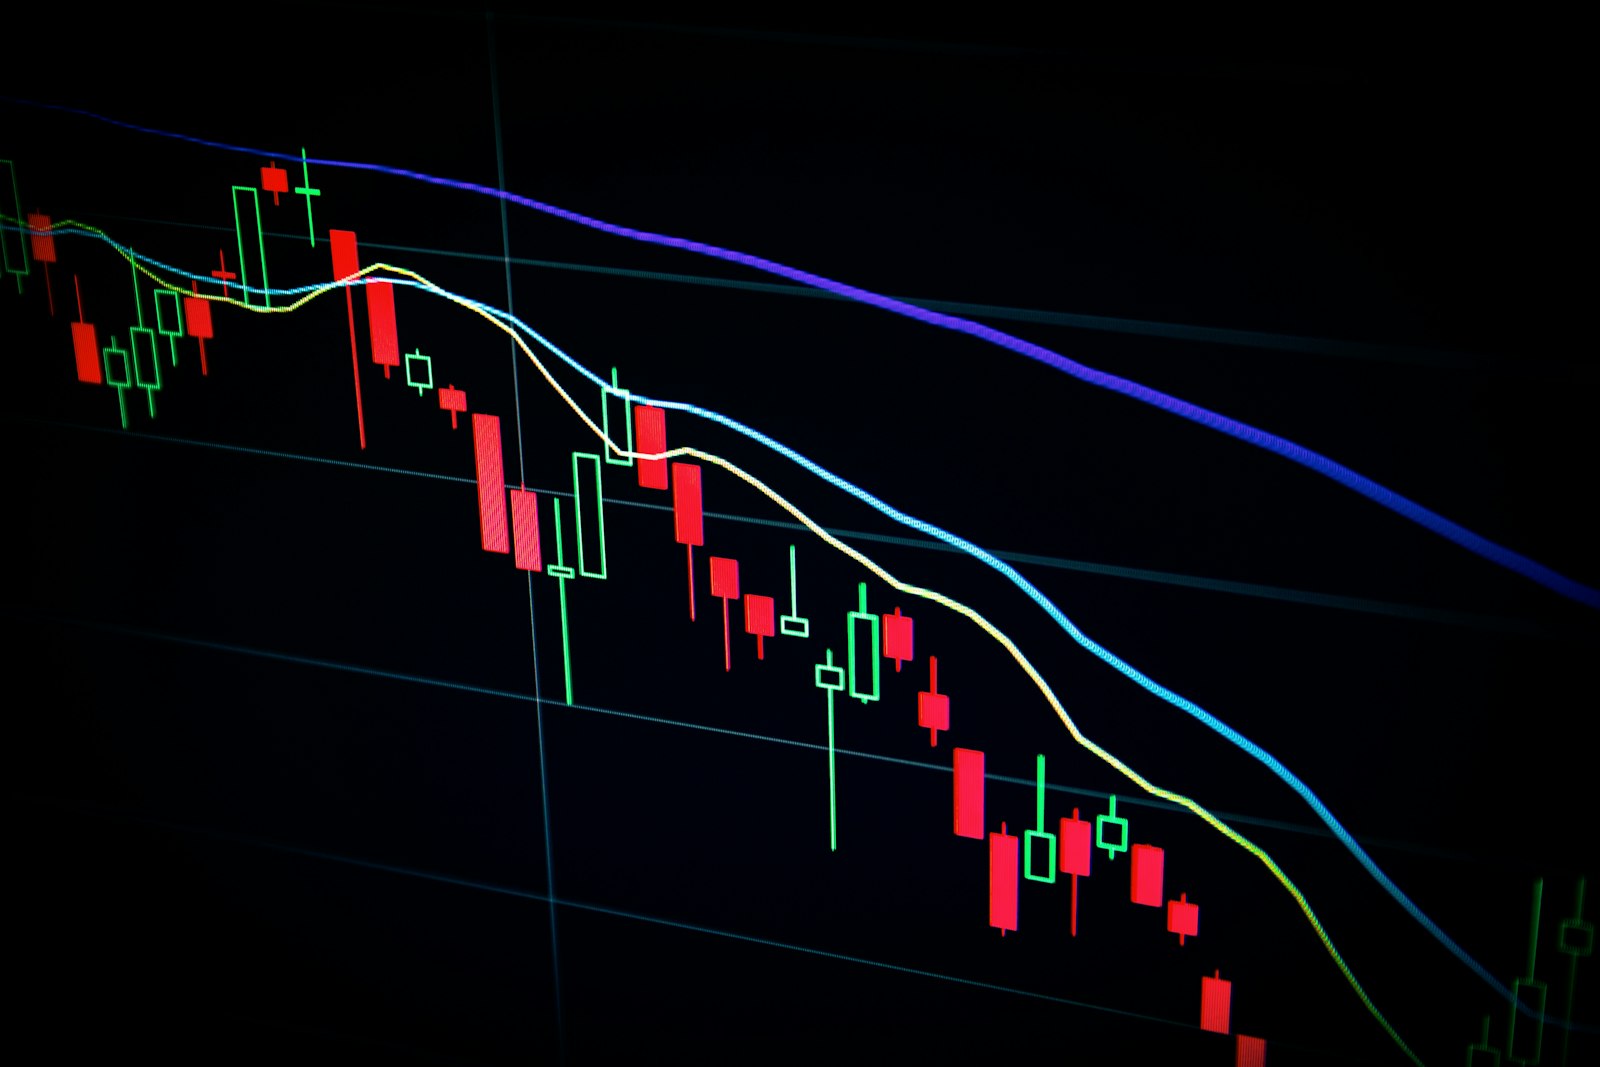
The two lines that actually lag
The Tenkan-sen (conversion line) and Kijun-sen (base line) are moving averages of recent highs and lows, nine and twenty-six periods respectively. Like any moving average, they describe where price has already been. A crossover between them confirms a shift in momentum after it has started, never before. If this is all you're reading, you're trading a slower version of a standard MA cross, and the lag complaint is fair.
What the cloud actually plots
The cloud (Kumo) is built from two lines that get plotted twenty-six periods into the future, not the present. Senkou Span A is the midpoint of the Tenkan and Kijun, shifted forward. Senkou Span B is the midpoint of the 52-period high/low range, shifted forward the same distance. The gap between them, shaded on the chart, is support or resistance that exists on the chart before price ever reaches it. That is the opposite of lagging: it's a projection, and it's the part of Ichimoku most casual explanations skip entirely.
How we read it on EUR/USD
EUR/USD is the deepest, most liquid market in the world, which is exactly why a projected cloud holds up better here than on a thin pair where one desk moving size can invalidate a level in an afternoon. On the daily and 4-hour charts we track three things from the cloud alone, before Fibonacci or anything else enters the read:
- Price relative to the cloud. Above it is a bullish regime, below it bearish, inside it is no trade: the cloud itself is telling you the market hasn't committed yet.
- Cloud thickness ahead. A thick projected cloud is a harder floor or ceiling to break; a thin or twisting cloud (a "Kumo twist") marks where the projection itself is losing conviction.
- Span A vs. Span B. Span A above Span B colors the cloud in the bullish direction; the crossover point of the two spans is where the projected bias itself flips.
What the cloud doesn't tell you
Direction isn't a trade. The cloud will tell you EUR/USD favors upside above a given level; it will never tell you the price to actually pay, where a stop belongs, or where the move realistically runs out of room. That is a different question, answered with a different tool, which is why every forecast we publish pairs the Cloud read with a Fibonacci retracement on the last completed swing before it ever becomes an execution plan with a real entry, target and stop.
The Tenkan and Kijun lines lag, yes. The cloud does not: it is plotted twenty six periods ahead of price, so support and resistance sit on the chart before price reaches it.
That's not a slogan we came up with for this article, it's how every forecast actually gets built. Every EUR/USD forecast Ichimuhan publishes starts here, before the session opens, in writing, with the chart attached.